CRO can sound like a permanent hunt for another 0.1 percentage point. The practical version is simpler: a customer wants to buy, and the store should not get in the way. Conversion rate optimisation is the habit of finding that friction and checking whether removing it genuinely improves the business result.
The desired action is not always an order. In B2B it might be registering a company, downloading a price list, requesting a quote or speaking to sales. That is why the first job is not changing a button colour. It is agreeing what a valuable outcome looks like.
What is CRO?
A conversion rate is the proportion of sessions or users that complete a defined action. The number alone does not tell you what to change. CRO combines quantitative analysis, qualitative research, UX design, technology and controlled experiments.
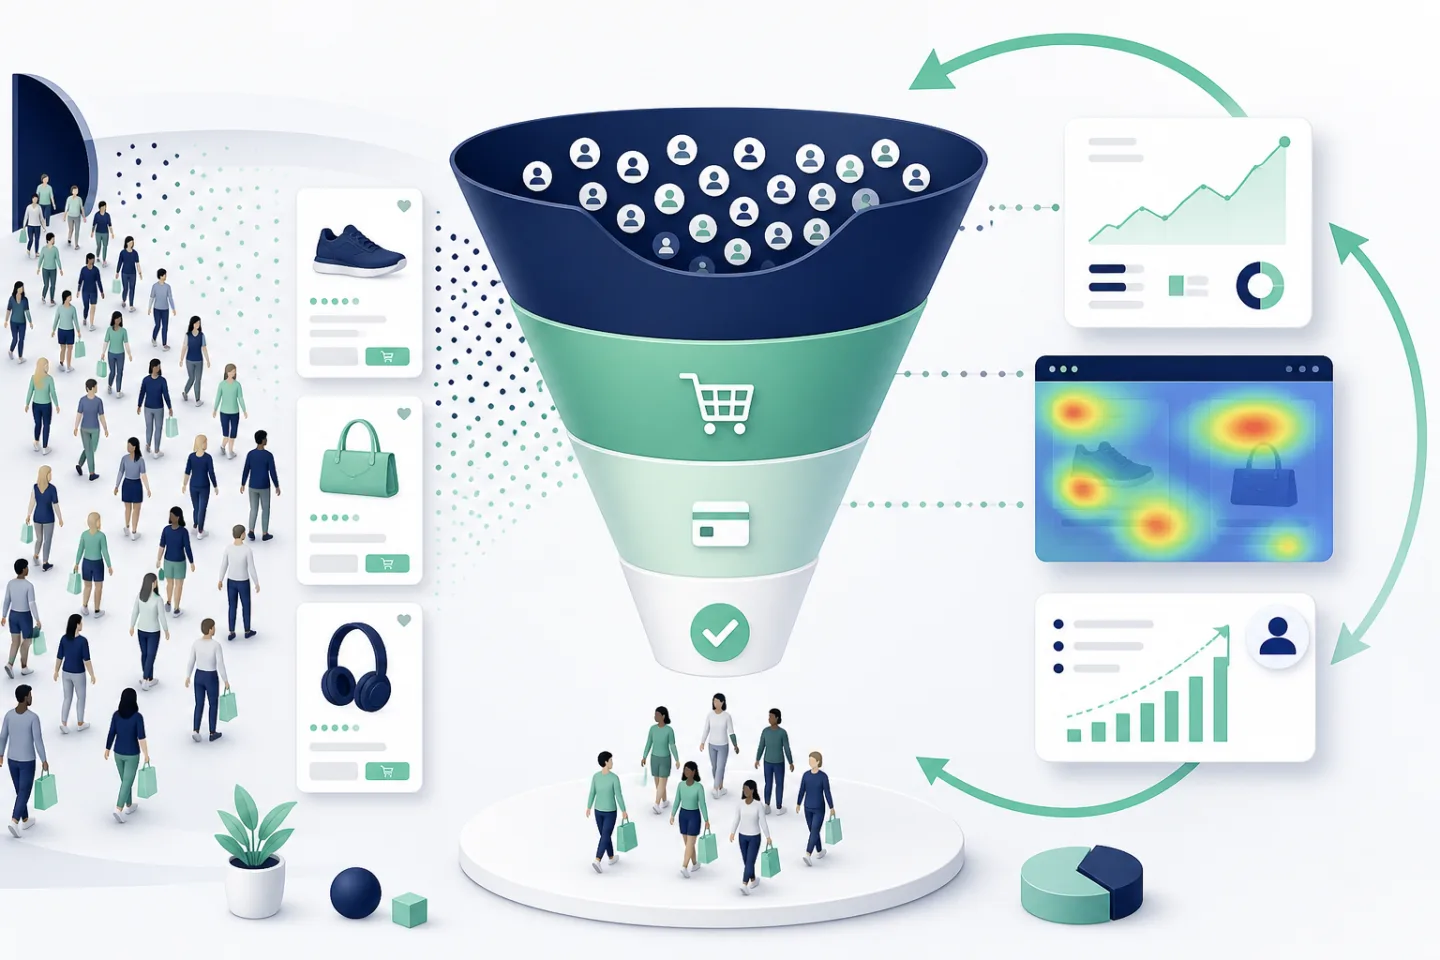
A common mistake is redesigning the interface on instinct. A stronger sequence is problem → evidence → hypothesis → change → measurement. Without this discipline, seasonality, a campaign or a product mix change can easily be mistaken for the effect of a redesign.
Not every improvement needs an experiment. If a form rejects valid telephone numbers or the payment button fails in Safari, fix the defect. Testing becomes useful when two or more sensible options exist and the team does not know which one will work better.
How does conversion affect revenue?
Revenue = qualified traffic × conversion rate × average order value
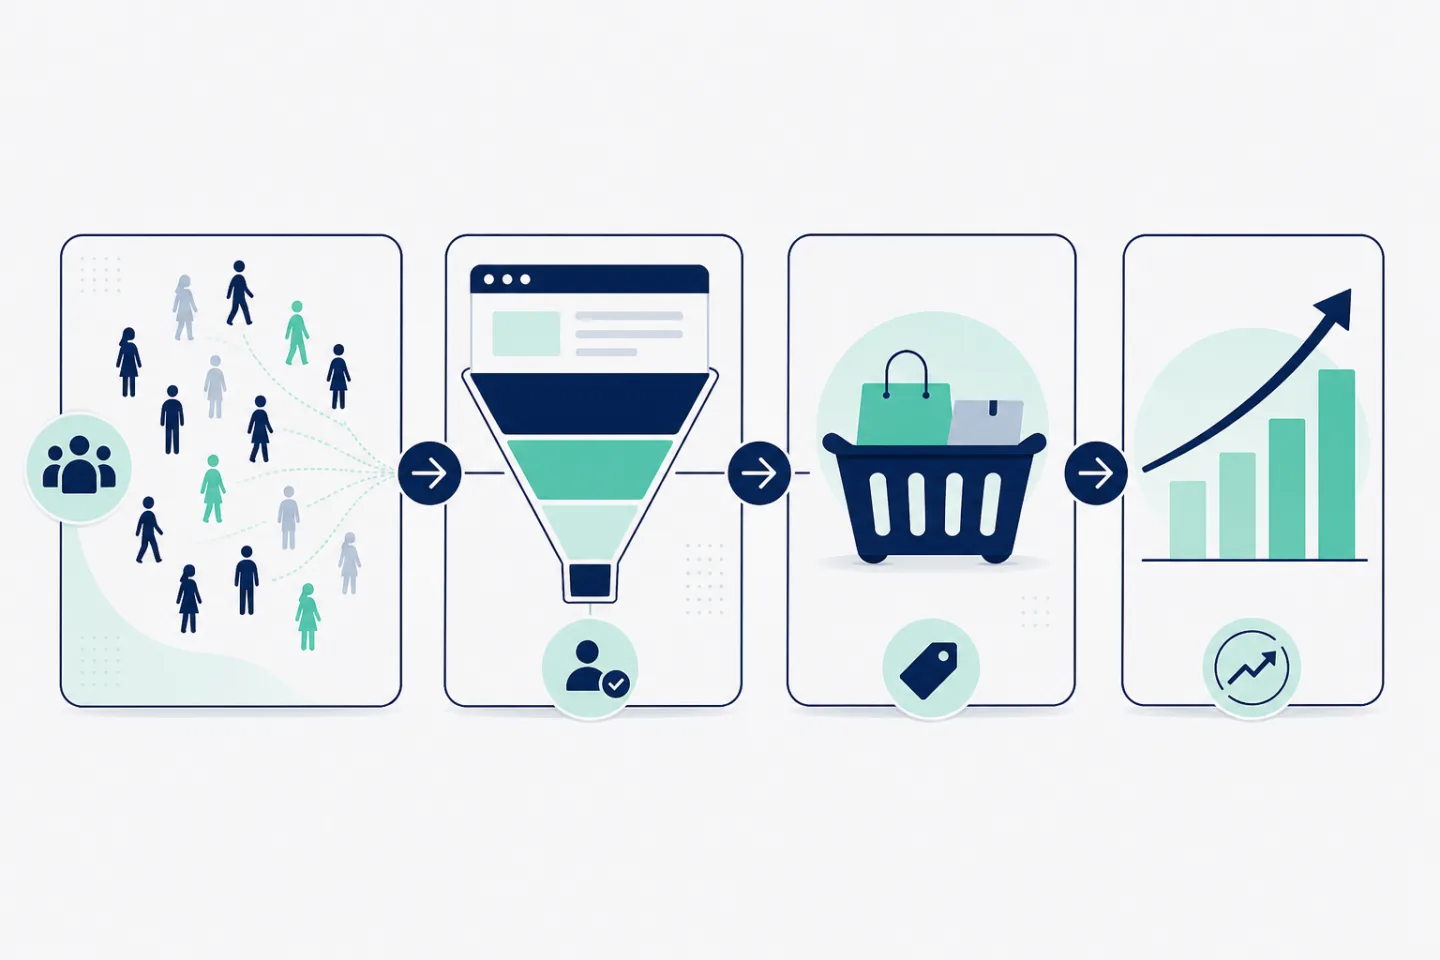
If a store attracts 100,000 qualified visits per month, converts 1.5% and has an average order value of £60, modelled revenue is approximately £89,800. Increasing conversion to 1.8% with the other variables unchanged produces approximately £107,700. The example is simplified, but it demonstrates the commercial value of improving the buying journey.
A real store also has margin, returns, cancellations and acquisition cost. More orders are not necessarily better if they come from an unprofitable promotion or generate a higher return rate. I do not optimise the conversion percentage in isolation from revenue quality.
Which data should you start with?
Check measurement before interpreting it. Is each transaction recorded once? Do consent choices remove part of the journey from the report? Is staff traffic excluded? A broken analytics setup can show a lovely trend that has nothing to do with sales.
The best picture combines several sources. Analytics shows where people leave. Session recordings and usability tests help explain why. Internal search reveals what customers cannot find, while support tickets surface issues no dashboard is likely to name.
A practical starting point: choose one segment and one journey, such as mobile checkout for new customers. The site-wide average usually combines several very different stories.
What does a CRO process look like?
- Measure: verify analytics, events and revenue data.
- Diagnose: combine funnel analysis with recordings, support tickets, search data and user research.
- Prioritise: assess expected impact, confidence, effort and risk.
- Design: define a clear hypothesis and the metrics that could disprove it.
- Implement and test: protect performance, accessibility and data quality.
- Learn: document the result and use it to shape the next decision.
A hypothesis should be specific enough to fail. For example: showing the full delivery cost in the basket will reduce abandonment between basket and address details. That is much more useful than “we will improve checkout”.
When should you use A/B testing?

Before starting, define the primary metric, guardrail metrics, audience, test duration and stopping rule. Ending an experiment as soon as the result looks positive increases the risk of a false conclusion. Also account for sales cycles, weekdays, campaigns and technical changes running at the same time.
For a lower-traffic store, usability sessions, prototype tests and high-confidence fixes often produce more value than waiting months for statistical significance. Performance, accessibility, broken validation and unclear information do not need to sit in an experiment backlog.
What usually gets in the way at checkout?
Checkout is a sensible place to begin because purchase intent is already high. Long-running Baymard Institute checkout research shows that cart abandonment is widespread and that avoidable UX friction accounts for part of it. Not every abandoned basket can be recovered — plenty of people are comparing or browsing — but the interface problems are within the team’s control.
- The full delivery cost appears too late.
- Account creation is mandatory without a business reason.
- Validation rejects data without explaining how to fix it.
- A popular delivery or payment option is missing.
- The mobile order summary obscures the main action.
- Nothing visible happens for several seconds after a click.
Magento 2 checkout is connected to payment, shipping, tax and integrations. Even a small visual change deserves regression testing. A cleaner form is not a win if it breaks orders for one market or payment method.
What should you measure beyond conversion?
- revenue and gross margin per visitor,
- average order value and items per basket,
- progress between checkout steps,
- payment and form error rates,
- returns, cancellations and customer support contact,
- performance and Core Web Vitals,
- results by device, source, market and customer type.
Effective CRO is not a collection of interface tricks or “growth hacks”. It is a calm cycle of measuring, understanding, improving and checking the result. It works best when analytics, UX and development sit close enough to discuss the same customer problem rather than passing tickets between silos.